Update on air pollution during COVID-19 – May data
Prepared by Prof. Alberto Troccoli.
With May 2020 air quality data in, and COVID-19 lockdown restrictions being relaxed in some countries, we see signs air quality is closing the gap compared to the same time in 2019.
As we discussed in our previous blog post, this unprecedented and dramatic situation has had a beneficial effect on air quality around us and worldwide. With COVID-19 lockdowns being gradually relaxed around the world, air quality data show how in some countries the recovery is accompanied by an increase in air pollution. With the May 2020 air quality data in, the two polluting gases Nitrogen Dioxide (NO2) and Carbon Monoxide (CO) we have been tracking show that while globally their values are still below the 2019 levels, in some in places like Europe and Australia, CO has increased. Curiously, however, China has recorded a drop (around 10% in CO from April to May) in spite of the fact that it has been one of the first countries to ease lockdown restrictions. Overall, global values for both gases are still below 2019 values, with 11% and 2% respectively.
The maps below present a highlight of the geographical distribution of CO for Europe and Australia, while the plots indicate the evolution of the two gases globally and for a few regions. A more extensive set of maps and movies are available on our previous regularly updated news item Want to be informed about air pollution data during COVID-19 restrictions?
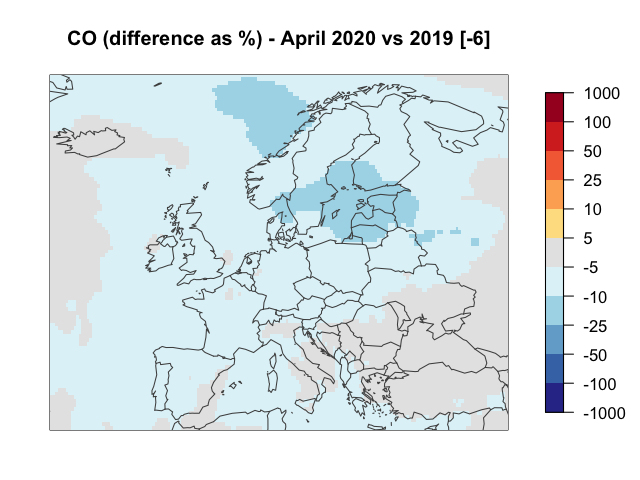
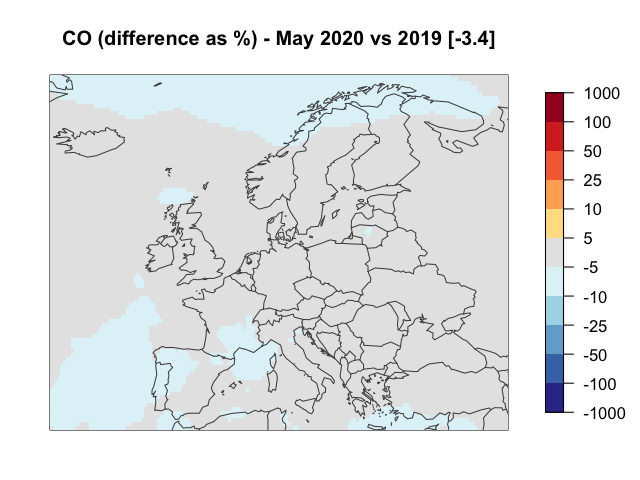
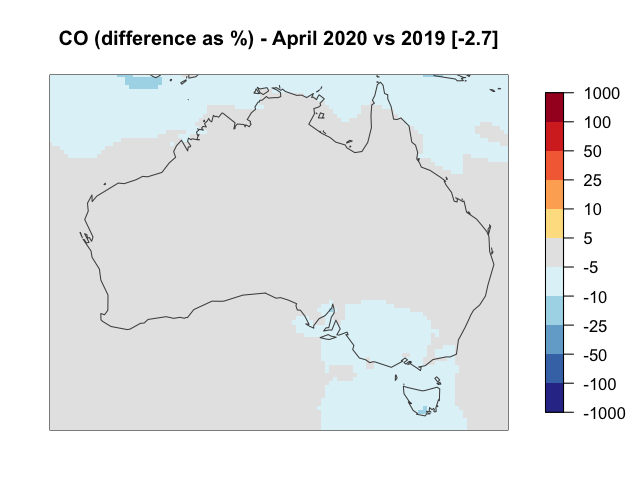
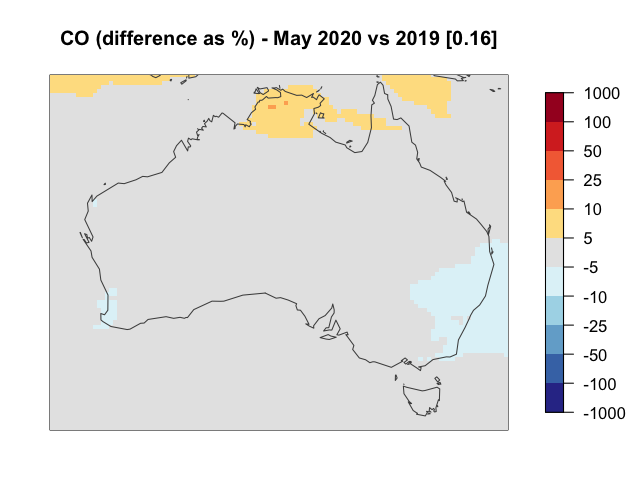
Carbon Monoxide Maps for Europe and Australia
Comparing Carbon Monoxide levels for April (left) with May (right) as percentage changes compared to 2019. Over most of Europe, CO is closer to 2019 in May than it was in April. Over Australia, the area around Darwin (in the north) has actually seen CO go above 2019 levels. However, it has decreased over a large part of New South Wales.
 |
 |
 |
 |
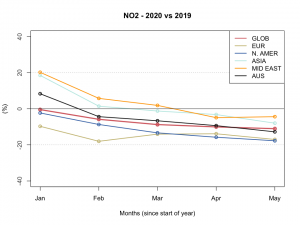
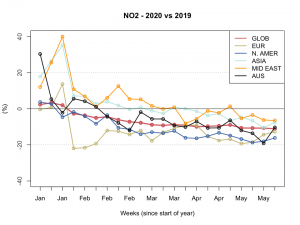
Nitrogen Dioxide (NO2)
Area averages of percentage change of 2020 vs 2019 for NO2 as a function of the month (left) and week (right) of the year for the globe (red line) and for selected areas (see a more comprehensive data display by clicking here)
 |
 |
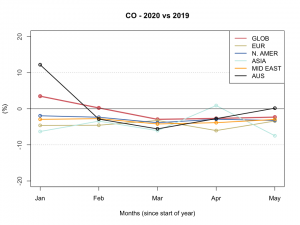
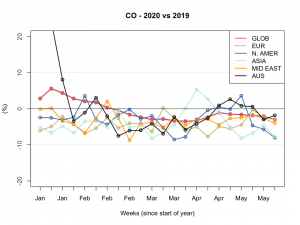
Carbon Monoxide (CO)
Area averages of percentage change of 2020 vs 2019 for CO as a function of the month (left) and week (right) of the year for the globe (red line) and for selected areas (see a more comprehensive data display by clicking here)
 |
 |
The main source of NO2 resulting from human activities is the combustion of fossil fuels (coal, gas and oil) especially fuel used in cars. It is also produced from making nitric acid, welding and using explosives, refining of petrol and metals, commercial manufacturing, and food manufacturing. Inhalation of NO2 increases their risk of respiratory infection and may lead to poorer lung function. CO also is a product of combustion of fuel such as natural gas, coal or wood. Vehicular exhaust contributes to the majority of carbon monoxide let into our atmosphere. CO has been linked to lung diseases.
The data presented here are taken from the Copernicus Atmosphere Monitoring Service (CAMS). Specifically, data come from the CAMS Near Real Time (NRT) Re-analysis which is available a few days behind real time. Re-analyses are combinations of observations (from ground stations, satellite, etc.) and a very advanced physical model. The CAMS NRT Re-analysis is downloaded at ca. 50 km x 50 km horizontal spatial resolution and every six hours (namely four values daily, at 00:00 UTC, 06:00 UTC, 12:00 UTC and 18:00 UTC). More comprehensive data views can be seen in our earlier post.
Data courtesy of Copernicus Atmosphere Monitoring Service (CAMS)