Teal Tool Version 1.7 Release – Regions, States and 2020 Data
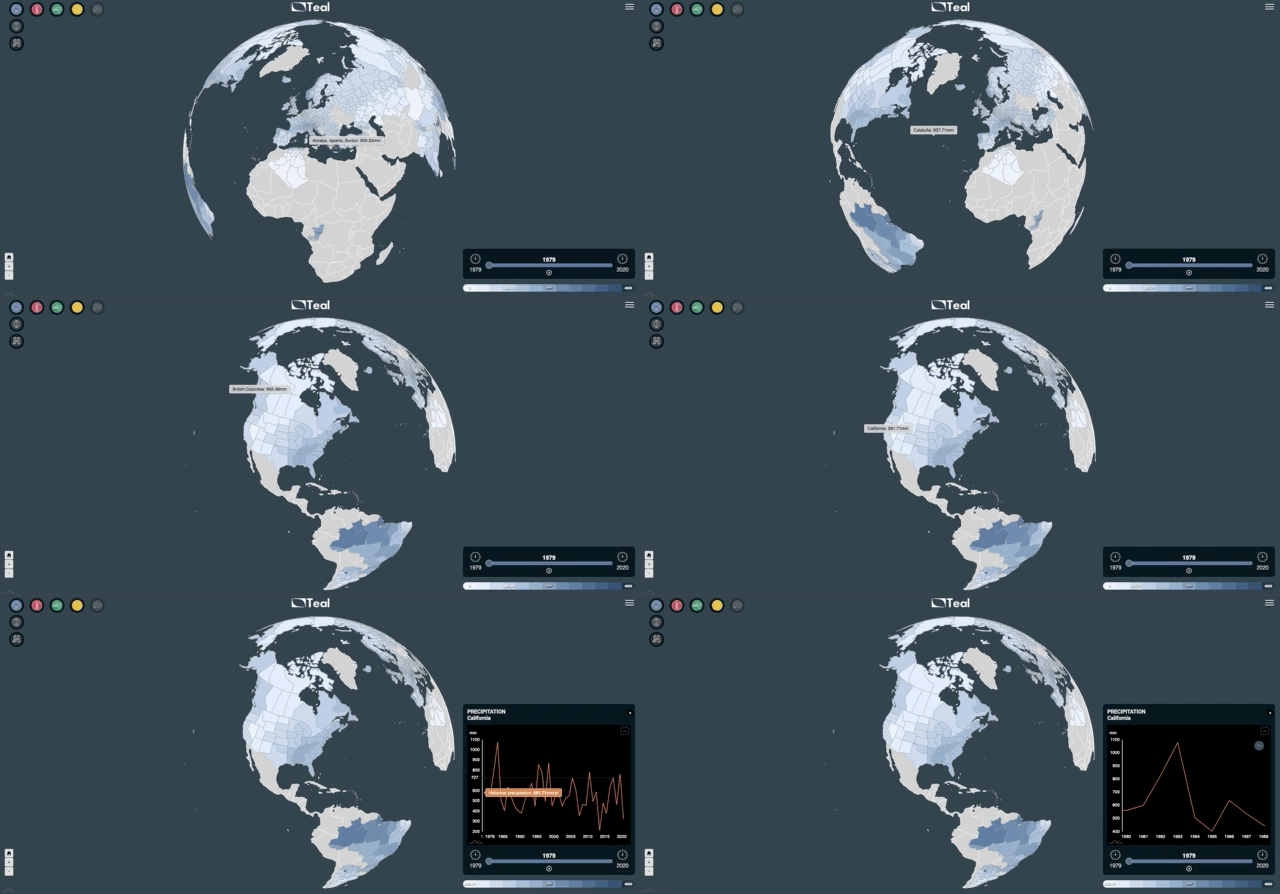
The latest version 1.7 of the Teal tool is now online and free to explore!
Teal is a free visual tool that enables you to explore climate variables and carbon emissions for the past 40+ years, from 1980 to near real time.
Quite a bit has changed since the last update. Most notably, in addition to Europe, Teal now supports regions and states for the 11 largest countries*. This has been one of our most requested features! We have also simplified the menu system, with just two geographical views: Countries and Sub-Countries. In addition to this, all historical data has been updated to 31st December 2020.
There is also a new share button in the main menu, which allows users to share their session with a URL. Also, the current session is saved to cache, so users can pick up where they left off next time they visit Teal.
What’s New:
- New simplified menu, with two geographical views: Countries and Sub-Countries
- Europe and other sub-regions are now merged into same view
- Data extended to end December 2020
- Share button in main menu, allows for link to your current session to be shared
- Previous session now saved to cache, so user can pick up where they left off
- Fixed menu issues on mobile
- General bug fixes and improvements.
Known Bugs:
- Congo region needs updating to Democratic Republic of Congo
- Using play button in Sub-Countries is slow to cycle through dates
- Sub-Countries view takes time to load
- ‘Download Map Data’ option is broken on Chrome due to Chrome updates preventing http > https direct downloads.
*Teal now supports regions and states for the 11 largest countries:
| Pos | Country | Total in km2 (mi2) |
| 1 | Russia | 17,098,246 (6,601,670) |
| 2 | Canada | 9,984,670 (3,855,100) |
| 3 | China | 9,596,961 (3,705,407) |
| 4 | United States | 9,525,067 (3,677,649) |
| 5 | Brazil | 8,515,767 (3,287,956) |
| 6 | Australia | 7,692,024 (2,969,907) |
| 7 | India | 3,287,263 (1,269,219) |
| 8 | Argentina | 2,780,400 (1,073,500) |
| 9 | Kazakhstan | 2,724,900 (1,052,100) |
| 10 | Algeria | 2,381,741 (919,595) |
| 11 | Democratic Republic of the Congo | 2,344,858 (905,355) |
Example use case: Examining historical precipitation rates for California, USA.
- Select precipitation from the variable icons

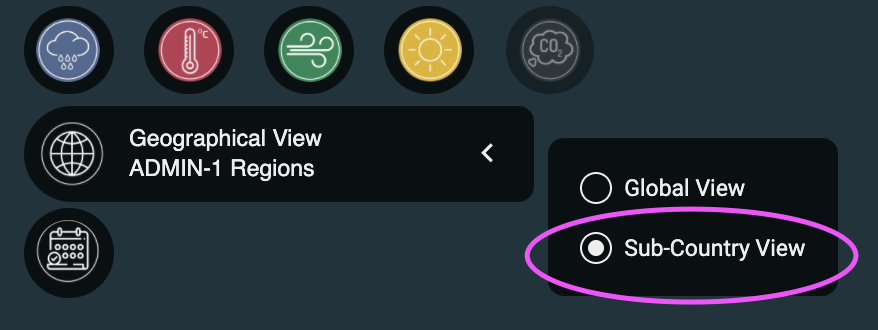
- Access states and sub-country regions via Geographical View and selecting ‘Sub-Country View’:
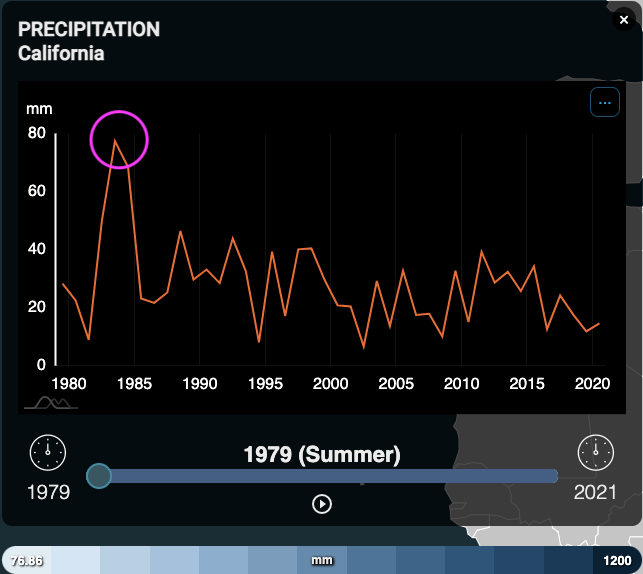
- Select California from USA states on map and a time-series plot should be viewable:
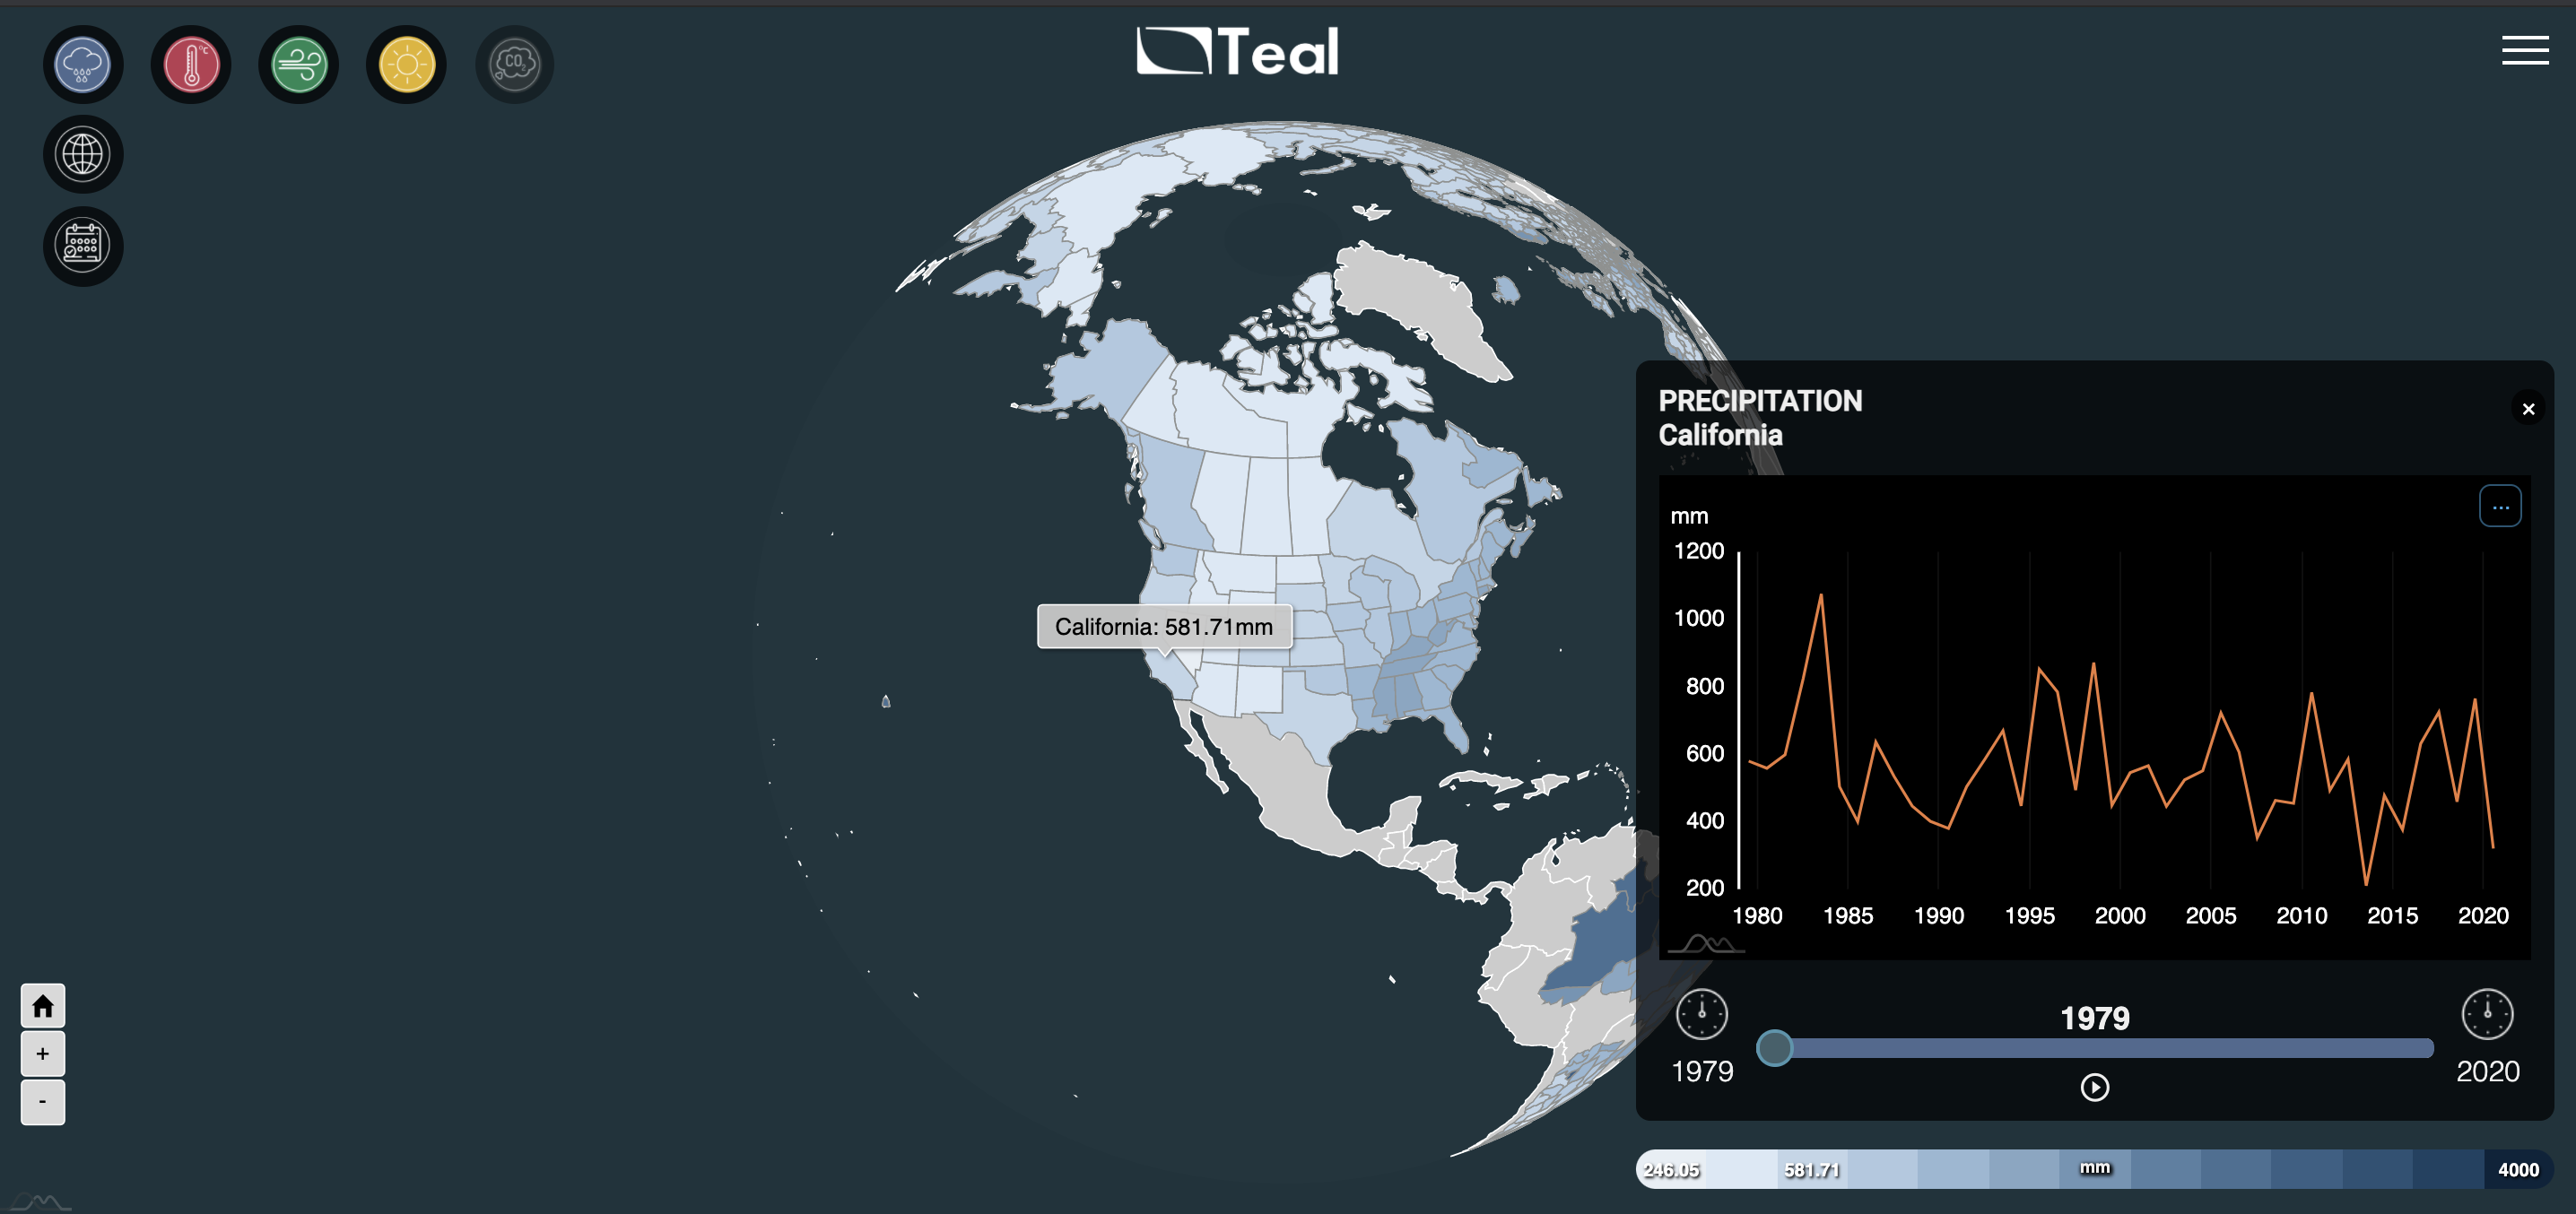
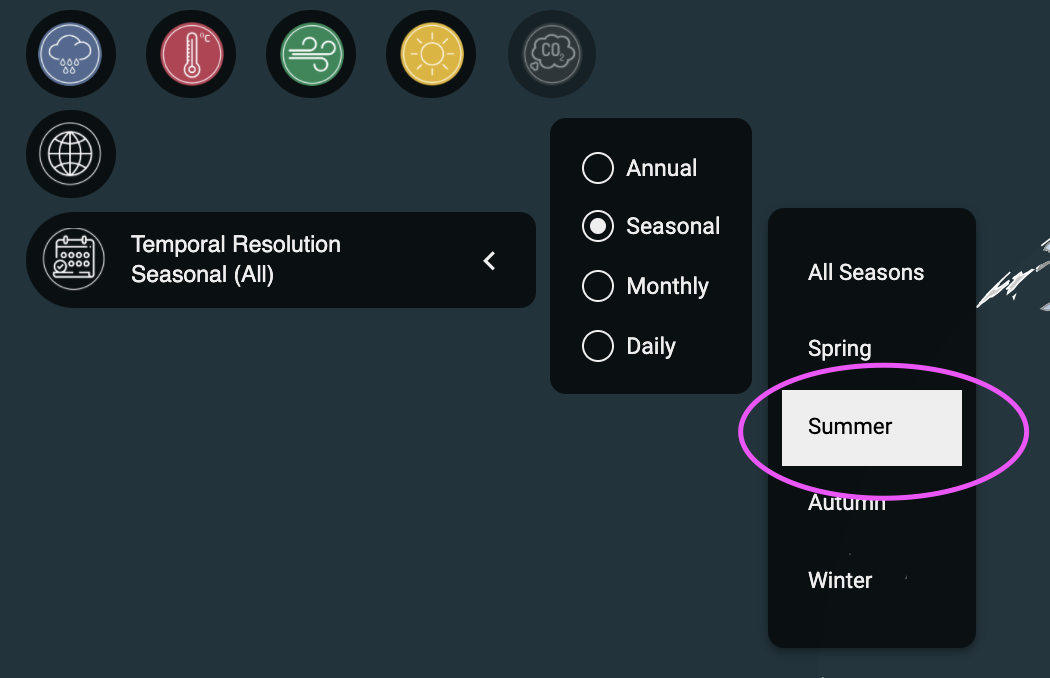
- From the plot, we can see that California is receiving less rainfall over the last 40 years. To investigate further, we can try selecting summer seasons to view how summers have changed in the same time period. There’s an interesting peak in 1983, which suggests there was a large amount of rainfall that summer.
A quick internet search brings up a wikipedia article, suggesting Los Angeles Airport having the wettest year on record in 1983:
“At the Los Angeles International Airport, the highest recorded temperature was 110 °F (43 °C) on September 26, 1963. The lowest temperature was 27 °F (−3 °C) on January 4, 1949. The wettest year was 1983 with 29.46 inches (748 mm) and the driest year was 1947 with 2.95 inches (74.9 mm). The greatest rainfall in one month was 13.79 inches (350 mm) in February 1998. The greatest rainfall in 24 hours was 5.60 inches (142.2 mm) on November 21, 1967.[37]“
Assuming that such an increase in rainfall would likely cause flooding, an additional internet search for ‘California flooding 1983’ reveals that Hurricane Ismael brought torrential rains and flooding to California in August 1983, washing out almost all the roads in Yucca Valley. This extreme weather event explains the anomaly shown in the Teal precipitation graph.
In conclusion, bringing regional and state-level data to Teal, greatly enhances the overall usability and usefulness of the tool, allowing for closer examination of extreme weather events. The earlier version of Teal looked at averaged data for larger countries and continents (such as the USA) and did not allow for localised climate variations to be examined.


