Teal Tool: Explore climate data easily
WHAT IS TEAL TOOL?
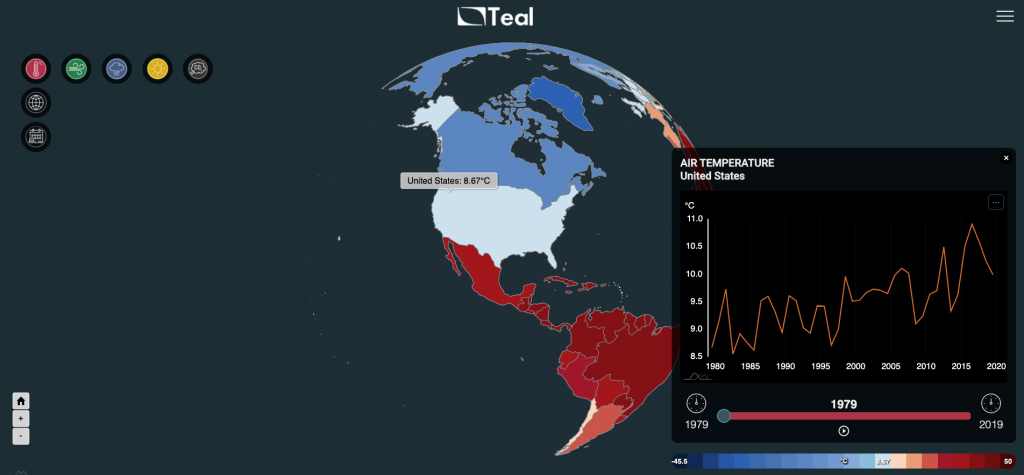
Teal is a free visualisation tool that enables you to explore climate variables from 1950 to near real time, and carbon emissions from 1960. It also allows to explore projections of climate variables from 2015 to 2100 for three different GHG emission scenarios (‘low’, ‘medium’ and ‘high’ emissions).
A global map shows climate data by country and sub-country. These show as temporal resolutions.
Teal is not an acronym, rather the name comes from the colour of its background! Try Teal today!
WHY CHOOSE TEAL TOOL?
Teal provides free access to easy-to-use climate data. You don’t need technical expertise in complex datasets to use Teal. The hard work has already been done for you by WEMC climate data specialists. In a few clicks you can visualise and download the data, as well as graphs, that can be used to inform your decisions.
For more information and opportunities surrounding Teal, please contact us here.
WHAT ARE THE BENEFITS OF USING TEAL TOOL?
Teal offers a free and unique opportunity for students, educators, climate activists and the environmentally-conscious public to explore how the climate has changed. It is ideal for enhancing global dialogue, participation and sharing ideas in climate change education and awareness.
Teal can also assist businesses within industries including energy, water, agriculture and insurance to make informed management and development decisions based on robust historical, projection, observation climate data. Teal helps businesses to drive action as it removes the need to spend time collecting and visualising climate data manually.
WHERE DOES THE TEAL DATA COME FROM?
TEAL was built on previous C3S demo tools: the European Climatic Energy Mixes (ECEM, 2015-2018) demo and the C3S Climate & Energy Educational Demo (2019-2020).
The historical climate data comes from the ECMWF ERA5 datasets that provide hourly estimates of a large number of atmospheric, land and oceanic climate variables. Additional information on ERA5 including resolution and accuracy can be found here.
The carbon emission data comes from the Global Carbon Project (GCP). The best and only reference to the data can be found here, which is updated every year.
The projection data comes from ten of the CMIP6 (the Coupled Model Intercomparison Project Phase 6) models, more details on CMIP6 data for users is found here. The ten models were chosen with the constraint that they had available, at the time the data was downloaded, all four variables for all three scenarios that Teal uses.
Note that both ERA5 and CMIP6 data derive from global models of the Earth-atmosphere-ocean system with computational constraints on spatial resolution, so some small scale meteorological features may not be well represented.
The historical temperature observations come from the Climate Research Unit (CRU) dataset.

Info on the datasets/CSV files
Teal versions
Variable Fact Sheets
Click on an icon below to download a factsheet for that variable, containing definitions, fun facts, a glossary and more!
Climate Variables
The following climate variables can be selected via the Edu Demo: air temperature, wind speed (at 10m height), total precipitation and solar radiation. These are chosen both for their importance as climatic indicators, but also because the are the main factors affecting the energy variables displayed with the Edu Demo.
Air temperature is the main indicator of how the climate evolves. It is linked to electricity demand, and can also affect solar power production.
Wind speed provides an indication of the strength of the atmospheric circulation. It is also linked to wind power production.
Precipitation provides an indication of how wet or dry the earth system is. It is also linked to hydroelectric production (the latter is not currently available on the Edu Demo).
Solar radiation is the amount of energy coming from the sun that reaches the ground. It is also linked to solar power production.

Carbon dioxide (CO2) is a colourless, odourless and non-poisonous gas formed by combustion of carbon and in the respiration of living organisms and is considered a greenhouse gas. Emissions means the release of greenhouse gases and/or their precursors into the atmosphere over a specified area and period of time.
Current version: v2.0E (08/09/2022)
What’s New:
- Update: New geographical menus Powerzones, IT Provinces.
- Update: Data extended to end August 2022
- Update: Seasonal Forecast feature
- Update: Added Weather forecast feature
- Updated new variables like Wind Direction, Relative Humidity and Sea Pressure.
- Added Observation data for temperature.
Known Bugs:
- Sub-Countries Daily data take a bit of response time.
- Menu enhancements for better user experience.
Previous versions
v1.0 (12/03/2021)
- Update: New simplified menu, with two geographical views: Countries and Sub-Countries.
- Update: Europe and other sub-regions are now merged into same view.
- Update: Data extended to end December 2020
- Update: Share button in main menu, allows for link to your current session to be shared
- Update: Previous session now saved to cache, so user can pick up where they left off
- Fixed menu issues on mobile
- General bug fixes and improvements
Known Bugs:
- Congo region needs updating to Democratic Republic of Congo
- Using play button in Sub-Countries is slow to cycle through dates
- Sub-Countries view takes time to load
- ‘Download Map Data’ option is broken on Chrome due to Chrome updates preventing http > https direct downloads
v1.0 (26/11/2020)
- Update: Fixed seasonal map data points, so all seasons show
- Update: About tab has been updated with links to Teal webpages
- Update: Fixed Precipitation min/max values
Known issues: on mobile, the country plots change, using the drop down menu, but not the name of the country (after the switch to a new country)
v0.2 (09/10/2020)
- Update: Fixed europe sub-regions (NUTS2)
- Update: Fixed min/max issues on colour slider
- Update: Removed unnecessary filter icons during tour
Known issues:
- Kosovo not showing correct data
- Some issues with the Precipitation min/max values
v0.1 (09/10/2020)
- Update: Fixed missing countries
- Update: Added max/min values to colour bar
Known issues:
- Europe sub-regions not loading
- Some issues with the mix max values on colour slider
v0.0 (05/05/2020)
- …
Frequently Asked Questions:
At launch, Teal supports historical data until end 2020. However in future updates we will bring the available historical data close to ‘real-time’ (1 week lag).
Including the planned climate projections updates, this will expand the total covered time range to 1979 – 2100.
Contact:
Please contact us for more information and opportunities surrounding Teal. If you encounter any issues using the tool, these can often be resolved by refreshing the webpage. If you discover a persistent and repeatable bug, please send us a message, including your browser (eg Chrome, Firefox etc) , operating system (OSX, Windows, Linux) and device (PC, iPhone, tablet).
Alternatively, you can contact us on the Teal Tool Instagram account!


