TECH BLOG 8: How To Make Mapshaper Output Compatible With amCharts4, Using Python
William Boyer is a software engineer at WEMC. William works on creating the tools we produce at WEMC, helping bridge the gap between the energy industry and the wider climate science community. In this blog he shows us how he overcame some compatibility issues with mapshaper shapefiles and amCharts.
The C3S Edu Demo uses the amCharts javascript library for map generation. This library comes with a number of maps, in both high-detail and low-detail varieties, but sometimes you may need a map which amCharts doesn’t have.
Problem
I needed to produce a map describing the different European continental maritime (or MAR0) regions. Assuming you start with a shapefile, converting this to a GeoJSON is usually straightforward.
Initial Solution
Mapshaper is a free tool which can perform this conversion, while also making other necessary changes to the GeoJSON output, such as:
- Adding an ‘id’ field, used by amCharts to display data on each region.
- Simplification, to reduce file size at the expense of detail. Simplifying by 99% retains a useful amount of detail, while reducing the output file size from ~70MB to ~1MB, making the map more responsive.
Troubleshooting
While the above features make Mapshaper an almost ideal tool for converting shapefiles to GeoJSON, I found Mapshaper’s output to not be immediately compatible with amCharts, as shown below:

All area outside the Portuguese maritime region is filled, but not the region itself. This is due to Mapshaper listing co-ordinates anti-clockwise, when amCharts assumes that all GeoJSON files are plotted clockwise.
Clockwise and Anti-Clockwise Plots
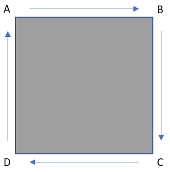
Co-ordinates in a GeoJSON must be plotted sequentially, so that the shape can be plotted by ‘joining the dots’ corresponding to the co-ordinates. These co-ordinates can be placed in a clockwise or anti-clockwise order. Below is an example of how clockwise-ordered co-ordinates could form a square:
And an example of the same shape if co-ordinates were listed in the opposite order:
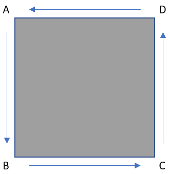
Typically, anti-clockwise shapes are assumed to be the outer boundary of the polygon, and clockwise order indicates gaps in the polygon. These assumptions are reversed in amCharts. As a result, when an anti-clockwise ordered GeoJSON is loaded into a map series expecting a clockwise order, amCharts assumes that the polygon should be inside-out, as shown below:

Inverting the Co-ordinates
Since Mapshaper has no option to reverse the co-ordinates in its output, and amCharts will not read the GeoJSON file in an anti-clockwise manner, I must reverse the order of the co-ordinates ourselves. I’ve opted to do this in Python:
[pastacode lang=”python” manual=”import%20json%0A%0A%0A%0A%0Ainput_file%20%3D%20%22path%2Fto%2Foldfile.geojson%22%0A%0Aoutput_file%20%3D%20%22path%2Fto%2Fnewfile.geojson%22%0A%0A%0A%0A%0Awith%20open(input_file%2C%20’r’)%20as%20infile%3A%0A%0A%C2%A0%C2%A0%C2%A0%20map%20%3D%20json.load(infile)%0A%0A%0A%0A%0Ano_of_regions%20%3D%20len(map%5B’features’%5D)%0A%0Afor%20i%20in%20range(no_of_regions)%3A%0A%0A%0A%0A%0A%C2%A0%C2%A0%C2%A0%20no_of_blocks%20%3D%20len(map%5B’features’%5D%5Bi%5D%5B’geometry’%5D%5B’coordinates’%5D)%0A%0A%C2%A0%C2%A0%C2%A0%20for%20j%20in%20range(no_of_blocks)%3A%0A%0A%C2%A0%C2%A0%C2%A0%C2%A0%C2%A0%C2%A0%C2%A0%20coordinates_list%20%3D%20%5B%5D%0A%0A%0A%0A%0A%C2%A0%C2%A0%C2%A0%C2%A0%C2%A0%C2%A0%C2%A0%20no_of_coordinates%20%3D%20len(map%5B’features’%5D%5Bi%5D%5B’geometry’%5D%5B’coordinates’%5D%5Bj%5D)%0A%0A%C2%A0%C2%A0%C2%A0%C2%A0%C2%A0%C2%A0%C2%A0%20for%20k%20in%20range(no_of_coordinates)%3A%0A%0A%C2%A0%C2%A0%C2%A0%C2%A0%C2%A0%C2%A0%C2%A0%C2%A0%C2%A0%C2%A0%C2%A0%20coordinates_list.append(map%5B’features’%5D%5Bi%5D%5B’geometry’%5D%5B’coordinates’%5D%5Bj%5D%5Bk%5D)%0A%0A%C2%A0%C2%A0%C2%A0%C2%A0%C2%A0%C2%A0%C2%A0%20coordinates_list.reverse()%0A%0A%C2%A0%C2%A0%C2%A0%C2%A0%C2%A0%C2%A0%C2%A0%20map%5B’features’%5D%5Bi%5D%5B’geometry’%5D%5B’coordinates’%5D%5Bj%5D%20%3D%20coordinates_list%0A%0A%0A%0A%0Awith%20open(output_file%2C%20’w’)%20as%20outfile%3A%0A%0A%C2%A0%C2%A0%C2%A0%20json.dump(map%2C%20outfile%2C%20indent%3D2)” message=”” highlight=”” provider=”manual”/]In the code above, I import the json library into this Python script, and work through each ‘block’ of co-ordinates. The order of each block of co-ordinates is reversed, and the result is placed in a new file.
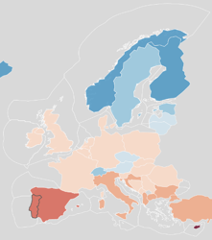
As shown below, this doesn’t quite have the desired effect; while certain regions work fine, the outside of all regions still has the same grey fill as the inside. This is because the Python script assumes each region to be made of a single shape (or polygon) when most are composed of multiple polygons. This changes the way co-ordinates are structured, so currently the script won’t affect all regions.
To resolve this, the script must act slightly differently depending on whether the region is a single polygon, or multiple polygons.
[pastacode lang=”python” manual=”import%20json%0A%0A%0A%0A%0Ainput_file%20%3D%20%22path%2Fto%2Foldfile.geojson%22%0A%0Aoutput_file%20%3D%20%22path%2Fto%2Fnewfile.geojson%22%0A%0A%0A%0A%0Awith%20open(input_file%2C%20’r’)%20as%20infile%3A%0A%0A%C2%A0%C2%A0%C2%A0%20map%20%3D%20json.load(infile)%0A%0A%0A%0A%0Ano_of_regions%20%3D%20len(map%5B’features’%5D)%0A%0Afor%20i%20in%20range(no_of_regions)%3A%0A%0A%C2%A0%C2%A0%C2%A0%20region_type%20%3D%20map%5B’features’%5D%5Bi%5D%5B’geometry’%5D%5B’type’%5D%0A%0A%0A%0A%0A%C2%A0%C2%A0%C2%A0%20if%20region_type%20%3D%3D%20’Polygon’%3A%0A%0A%C2%A0%C2%A0%C2%A0%C2%A0%C2%A0%C2%A0%C2%A0%20no_of_blocks%20%3D%20len(map%5B’features’%5D%5Bi%5D%5B’geometry’%5D%5B’coordinates’%5D)%0A%0A%C2%A0%C2%A0%C2%A0%C2%A0%C2%A0%C2%A0%C2%A0%20for%20j%20in%20range(no_of_blocks)%3A%0A%0A%C2%A0%C2%A0%C2%A0%C2%A0%C2%A0%C2%A0%C2%A0%C2%A0%C2%A0%C2%A0%C2%A0%20coordinates_list%20%3D%20%5B%5D%0A%0A%C2%A0%C2%A0%C2%A0%C2%A0%C2%A0%C2%A0%C2%A0%C2%A0%C2%A0%C2%A0%C2%A0%20no_of_coordinates%20%3D%20len(map%5B’features’%5D%5Bi%5D%5B’geometry’%5D%5B’coordinates’%5D%5Bj%5D)%0A%0A%C2%A0%C2%A0%C2%A0%C2%A0%C2%A0%C2%A0%C2%A0%C2%A0%C2%A0%C2%A0%C2%A0%20for%20k%20in%20range(no_of_coordinates)%3A%0A%0A%C2%A0%C2%A0%20%C2%A0%C2%A0%C2%A0%C2%A0%C2%A0%C2%A0%C2%A0%C2%A0%C2%A0%C2%A0%C2%A0%C2%A0%C2%A0coordinates_list.append(map%5B’features’%5D%5Bi%5D%5B’geometry’%5D%5B’coordinates’%5D%5Bj%5D%5Bk%5D)%0A%0A%C2%A0%C2%A0%C2%A0%C2%A0%C2%A0%C2%A0%C2%A0%C2%A0%C2%A0%C2%A0%C2%A0%20coordinates_list.reverse()%0A%0A%C2%A0%C2%A0%C2%A0%C2%A0%C2%A0%C2%A0%C2%A0%C2%A0%C2%A0%C2%A0%C2%A0%20map%5B’features’%5D%5Bi%5D%5B’geometry’%5D%5B’coordinates’%5D%5Bj%5D%20%3D%20coordinates_list%0A%0A%0A%0A%0A%C2%A0%C2%A0%C2%A0%20elif%20region_type%20%3D%3D%20’MultiPolygon’%3A%0A%0A%C2%A0%C2%A0%C2%A0%C2%A0%C2%A0%20%C2%A0%C2%A0no_of_polygons%20%3D%20len(map%5B’features’%5D%5Bi%5D%5B’geometry’%5D%5B’coordinates’%5D)%0A%0A%C2%A0%C2%A0%C2%A0%C2%A0%C2%A0%C2%A0%C2%A0%20for%20j%20in%20range(no_of_polygons)%3A%0A%0A%C2%A0%C2%A0%C2%A0%C2%A0%C2%A0%C2%A0%C2%A0%C2%A0%C2%A0%C2%A0%C2%A0%20no_of_blocks%20%3D%20len(map%5B’features’%5D%5Bi%5D%5B’geometry’%5D%5B’coordinates’%5D%5Bj%5D)%0A%0A%C2%A0%C2%A0%C2%A0%C2%A0%C2%A0%C2%A0%C2%A0%C2%A0%C2%A0%C2%A0%C2%A0%20for%20k%20in%20range(no_of_blocks)%3A%0A%0A%C2%A0%C2%A0%C2%A0%C2%A0%C2%A0%C2%A0%C2%A0%C2%A0%C2%A0%C2%A0%C2%A0%C2%A0%C2%A0%C2%A0%C2%A0%20coordinates_list%20%3D%20%5B%5D%0A%0A%C2%A0%C2%A0%C2%A0%C2%A0%C2%A0%C2%A0%C2%A0%C2%A0%C2%A0%C2%A0%C2%A0%C2%A0%C2%A0%C2%A0%C2%A0%20no_of_coordinates%20%3D%20len(map%5B’features’%5D%5Bi%5D%5B’geometry’%5D%5B’coordinates’%5D%5Bj%5D%5Bk%5D)%0A%0A%C2%A0%C2%A0%C2%A0%C2%A0%C2%A0%C2%A0%C2%A0%C2%A0%C2%A0%C2%A0%C2%A0%C2%A0%C2%A0%C2%A0%C2%A0%20for%20l%20in%20range(no_of_coordinates)%3A%0A%0A%C2%A0%C2%A0%C2%A0%C2%A0%C2%A0%C2%A0%C2%A0%C2%A0%C2%A0%C2%A0%C2%A0%C2%A0%C2%A0%C2%A0%C2%A0%C2%A0%C2%A0%C2%A0%C2%A0%20coordinates_list.append(map%5B’features’%5D%5Bi%5D%5B’geometry’%5D%5B’coordinates’%5D%5Bj%5D%5Bk%5D%5Bl%5D)%0A%0A%C2%A0%C2%A0%C2%A0%C2%A0%C2%A0%C2%A0%C2%A0%C2%A0%C2%A0%C2%A0%C2%A0%C2%A0%C2%A0%C2%A0%C2%A0%20coordinates_list.reverse()%0A%0A%C2%A0%C2%A0%C2%A0%C2%A0%C2%A0%C2%A0%C2%A0%C2%A0%C2%A0%C2%A0%C2%A0%C2%A0%C2%A0%C2%A0%C2%A0%20map%5B’features’%5D%5Bi%5D%5B’geometry’%5D%5B’coordinates’%5D%5Bj%5D%5Bk%5D%20%3D%20coordinates_list%0A%0A%0A%0A%0Awith%20open(output_file%2C%20’w’)%20as%20outfile%3A%0A%0A%C2%A0%C2%A0%C2%A0%20json.dump(map%2C%20outfile%2C%20indent%3D2)” message=”” highlight=”” provider=”manual”/]
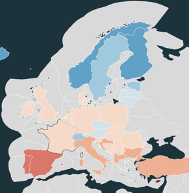
With all outer border co-ordinates now following a clockwise order, amCharts now displays all regions correctly:
For more tech blogs, click here.
Get Involved
Sign-up to our WEMC newsletter for the latest news
Follow us on Twitter and LinkedIn
Find out about free WEMC membership
William Boyer WEMC 3/8/20


