Bridging the Emissions Data Gap: Insights from the FOCI Project on Non-CO₂ Pollutants
In the global effort to better understand and address climate change, accurate data on emissions is more critical than ever. While much attention is given to CO₂, non-CO₂ pollutants such as methane (CH₄), nitrogen oxides (NOₓ) and others also play a significant role in driving climate change. The FOCI project (2022–2026), is a collaborative effort involving 17 partners from renowned universities, research institutions, and international organisations, and seeks to better understand the impacts of these pollutants by assessing their effects on the climate system and air quality.
A crucial element of this effort is examining emission inventories, being done in Work Package 5, where the World Energy and Meteorology Council (WEMC) is performing research on the role of different sectors — notably the energy sector — in contributing to non-CO₂ climate forcing pollutants. By ensuring that energy-related emissions are better understood, WEMC’s work supports the development of more precise modelling efforts.
In the pursuit of addressing climate change, assessing the impacts of key radiative forcers on the climate system and their implications, accurately measuring greenhouse gas emissions is vital. Comprehensive emissions data supports effective policy-making and strategic planning for mitigating climate change. This article presents an in-depth analysis of differences in emissions data between two prominent databases: the Community Emissions Data System (CEDS) and the Emissions Database for Global Atmospheric Research (EDGAR), which contributes to the FOCI project. The study covers multiple pollutants across various sectors and countries, with a focus on key differences and their potential implications.
Background
CEDS and EDGAR are two widely used global databases that provide estimates for greenhouse gas and pollutant emissions. While both are well-established and respected sources, they employ different methodologies, data sources, and assumptions, leading to differences in emission estimates. Analysing the differences is essential for understanding the uncertainties in emissions estimates used in modeling. Rather than producing independent estimates, the CEDS methodology relies on matching default estimates to reliable, existing emission inventories and extending those values to historical years, creating a consistent historical time series (Olivier et al., 2017). In the latest version of EDGAR, subnational-level data is incorporated into the development of new spatial proxies allowing for more accurate allocation and analysis of subnational emissions (Hoesly et al., 2018).
Analysis Overview
The study analysed eight major gas species: methane (CH₄), carbon monoxide (CO), carbon dioxide (CO₂), ammonia (NH₃), non-methane volatile organic compounds (NMVOC), nitrogen oxides (NOₓ), sulfur dioxide (SO₂), and nitrous oxide (N₂O). Each was assessed across various sectors to identify areas where significant differences between the CEDS and EDGAR datasets occurred.
To illustrate these differences, this article highlights findings from the ‘Oil and Natural Gas’ sector. This sector was chosen due to the significant differences observed between the two databases, showcasing the complexities and challenges in comparing emission data from multiple inventories.
The comparison of the CEDS and EDGAR datasets for the Energy sector is also discussed to explain variations in emissions data for countries known to be major contributors to global emissions. For key emission species such as NMVOC, CH₄, SO₂, CO, CO₂, and NOₓ, notable differences exist between the datasets for countries like China, India, the USA, and Russia. Nigeria is among the top contributing countries for three emission specie: NMVOC, CH₄ and CO.
Methodology
The analysis involved the following steps:
- Data Collection: Emissions data for the eight pollutants were gathered from both the CEDS and EDGAR databases.
- Data Extraction/Selection: Python software was used to extract and streamline the dataset by identifying and removing missing values.
- Comparison: Emissions for relevant sectors were summed, and absolute and percentage differences were calculated for each year from 2004 to 2019.
- Country-Level Analysis: The 10 countries with the most significant differences in emissions were identified to understand the global spread.
Key Findings
- At the global level:
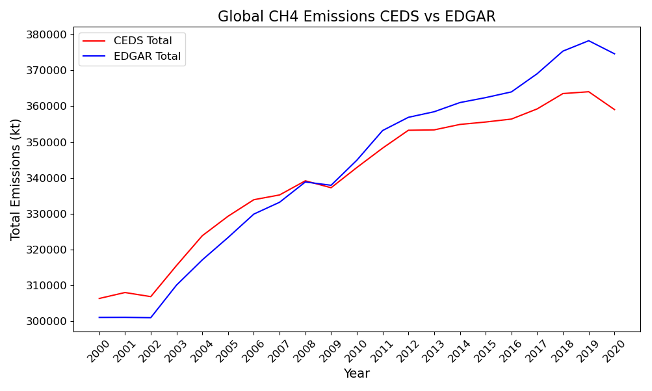
Where all sectors are included, the comparison between the CEDS and EDGAR datasets reveals significant differences, CEDS emissions for CH₄ start higher than EDGAR from 2004 to 2008, with the closest alignment occurring in 2008, when the difference narrows to just 780 kt. After this point, EDGAR emissions begin to exceed those of CEDS, marking a gradual shift that becomes more pronounced over time. By 2019, this divergence grows significantly, with CEDS reporting 14,510 kt less than EDGAR, indicating a widening gap in recent years and notable disparities between the two datasets.
[/vc_column_text]
- At the subsector level:
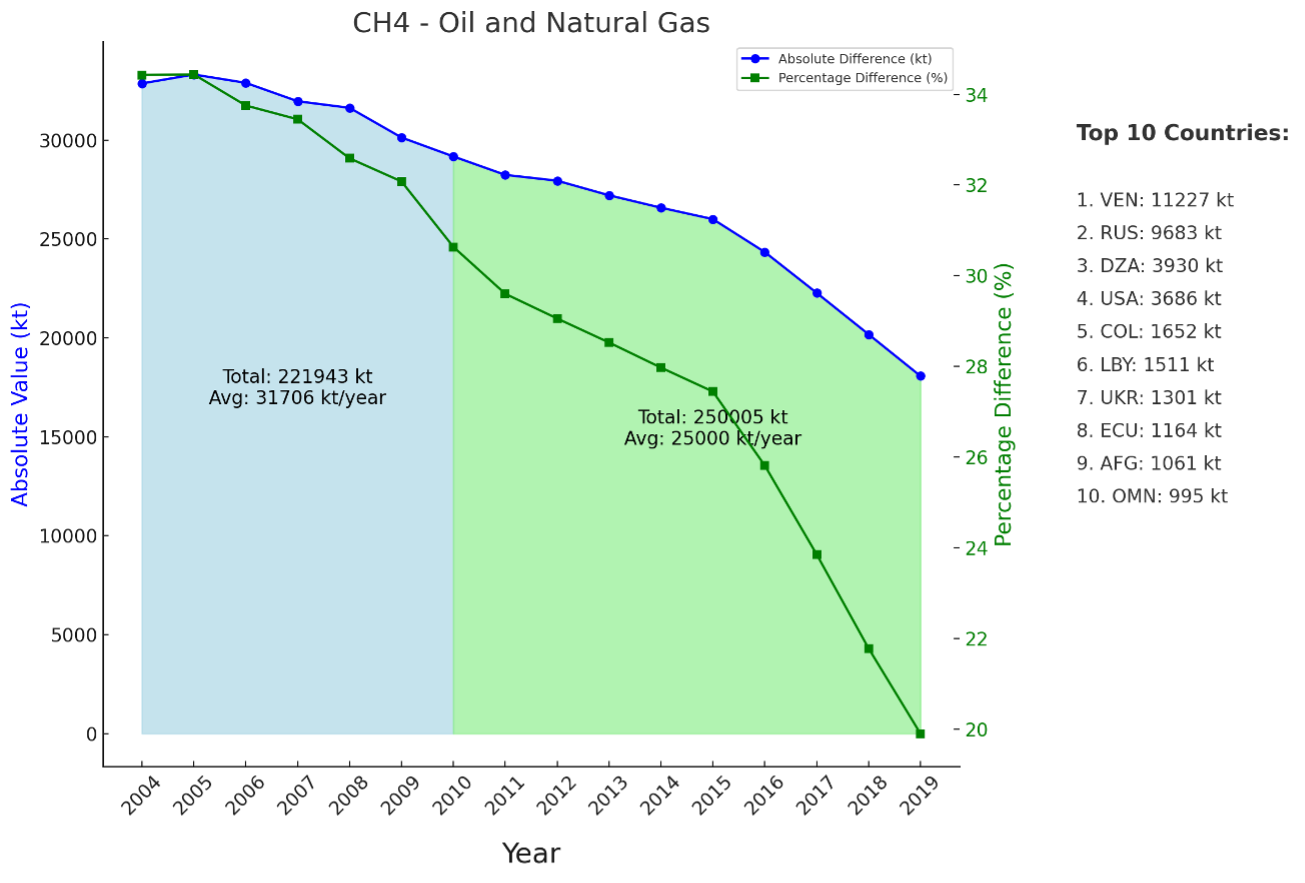
Analysis of CH₄ emissions in the ‘Oil and Natural Gas’ sector revealed notable absolute and percentage differences over the 16-year period, highlighting significant variations between datasets and key contributing countries.
Absolute values
The analysis of global CH₄ emissions differences between CEDS and EDGAR datasets revealed key patterns:
- The highest absolute differences were observed in the early years, specifically 2004 (32,861 kt) and 2005 (33,311 kt). These years marked the peak differences, suggesting significant methodological or reporting variations at the time.
- The absolute differences gradually decreased over time, with 2010 showing a significant difference of 29,169 kt. A more substantial reduction occurred from 2011 onwards, with 2017 showing a notable drop to 22,276 kt. By 2019, the difference had further reduced to 18,072 kt, indicating a potential alignment or improvement in data practices over the years.
Percentage Differences
The percentage differences, based on global CH₄ emissions, provided another perspective on the discrepancies:
- The largest percentage differences occurred in the earlier years, specifically 2004 (34.43%) and 2005 (34.44%), aligning with the highest absolute discrepancies.
- From 2006 to 2010, percentage differences showed a gradual decline but remained significant, with 2010 at 30.64%.
- After 2010, the percentage differences continued to decrease, reaching 23.85% in 2017, reflecting an improvement in relative consistency between the datasets.
- By 2019, the percentage difference had decreased further to 19.90%, indicating an overall trend of improved agreement between the CEDS and EDGAR data.
Top Countries with Significant Differences for CH₄
A key component of the study was identifying the countries with substantial discrepancies in methane CH₄ emissions for the ‘Oil and Natural Gas’ sector. The following countries exhibited the largest differences:
- Venezuela
- Russia
- Algeria
- The United States of America
- Colombia
Further research is needed to better understand the causes of these discrepancies across these nations, but in some cases, reasons could include regional variations in emission estimation methods or possible inconsistencies in data collection or reporting standards.

Energy Sector Emissions
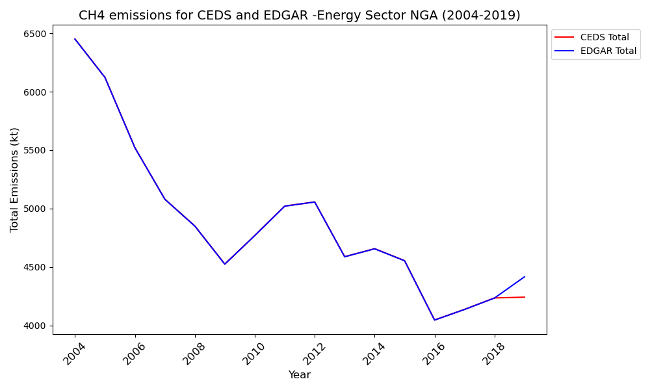
The emissions for the three species (NMVOC, CO, and CH₄) in Nigeria’s energy sector show no substantial differences between the CEDS and EDGAR datasets, except for CH₄ in 2019. In 2019, the EDGAR dataset indicates an increase in CH₄ emissions, while the CEDS dataset shows a decrease. When compared with figures from Nigeria’s National Inventory Report, the CEDS values align more closely with the reported national data.
However, there is insufficient information in either emissions inventory to explain the increase in CH₄ emissions in the EDGAR dataset for 2019. A comparison of subsector data from both CEDS and EDGAR with Nigeria’s reported figures still does not provide a clear reason for this discrepancy in the EDGAR dataset. This gap shows the need for further research to identify the source of these discrepancies, which would improve data verification and support more reliable trend analysis.

Policy and Research Implications
Understanding where and why discrepancies between inventories exist can help policymakers target areas for improved data collection and reporting practices. This can enhance transparency and accuracy, making climate action plans more effective.
Researchers are encouraged to explore the methodologies used by CEDS and EDGAR to identify the underlying causes of the differences and to align future reporting practices more closely. This underscores the need for clearer and more detailed emissions reporting, which is crucial for enhancing data verification and enabling accurate trend analysis.
Conclusion
This comparative study of emissions data between CEDS and EDGAR across eight major pollutants and various sectors highlights the importance of understanding how individual emission inventories are constructed. The example of the ‘Oil and Natural Gas’ sector illustrates just one case of significant differences, emphasizing the need to understand why these differences occur and to continue improving in emissions reporting practices.
As the global community works toward achieving climate goals, evaluating differences in emissions data is crucial for improving transparency and understanding. This study focuses on identifying and analyzing divergences between datasets, providing valuable insights into their origins and significance.
Stay connected with us on social media, and don’t forget to subscribe to our newsletter delivered to your inbox typically twice a year.


