Teal tool update: observations and projections
The World Energy & Meteorology Council (WEMC) just updated the Teal Tool with two major updates in the dataset: Observations and projections. The new data are visible in the graph plots and is available to download in the preferred format.
This blog briefly describes the two datasets, how they are plotted in the tool and some useful pointers to help you work with the data.
Observations
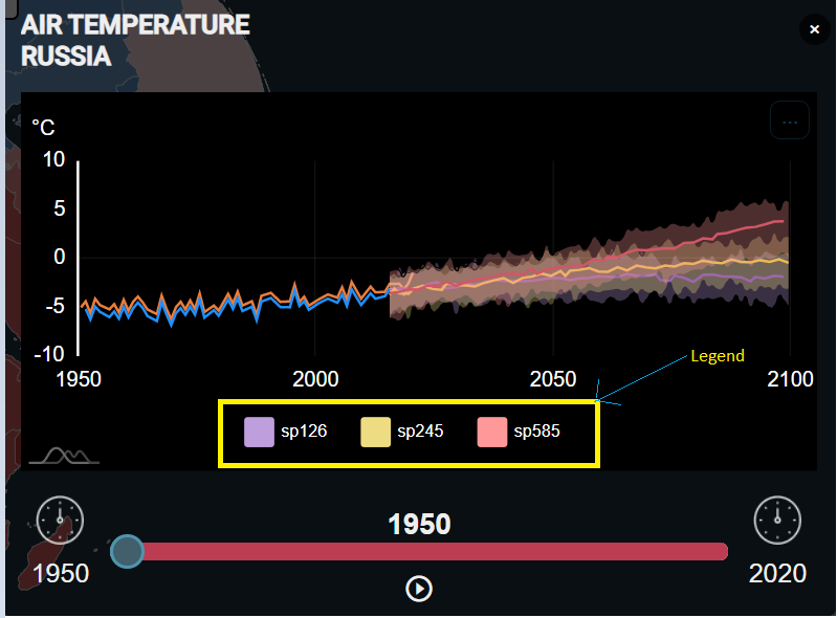
When a country and variable is selected on the map, the graph will now display the associated observations alongside the historical data from 1950 to 2021, similarly to the graph below.

Observations can be found for the following options:
Annual, Seasonal and Monthly
ADM0, ADM1
TA
Projections
What are climate projections?
Climate projections are simulations of Earth’s climate in future decades (typically until 2100) based on past climate observations.
When a country and variable is selected on the map, the plot will load the respective projections for three different scenarios (SP126, SP245 and SP585) along with the historical and observations data. Each scenario is projected with an average line with low and high range:
- Average Line: The average line corresponds to the ensemble mean (avg) of the particular climate model.
- Low Range: The Low range corresponds to the ‘Low’ emission scenario and it comes from q05 of the ensemble dataset.
- High Range: The High range corresponds to the ‘High’ emission scenario and it comes from q95 of the ensemble dataset.
The projections data available in this update are from 2015 until the year 2099.
Alongside the plot, there is a legend that allows you to select and visualise individual scenarios at a time. The legends contains a checkbox to allow the user to show/hide them based on their selection. This allows the user to analyse different combinations.
Note that the low and high range comes with the selectors whereas the average Ensemble mean is fixed to avoid confusion.

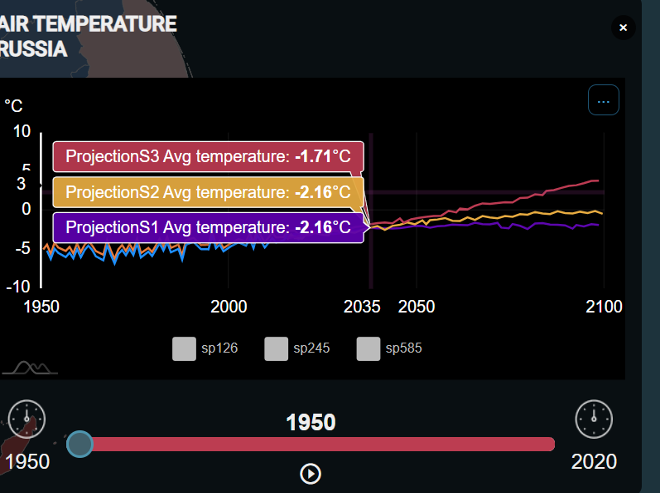
When the user hovers their mouse over the different selected scenarios, the values for each projection scenario will show on the plot, for a more user-friendly experience, as evident in the following graph:

Future Updates
These observation and projection updates to the Teal tool are useful to detect and attribute climate change and its impacts. If you are a student or someone who is interested in climate change, the Teal tool would be an invaluable addition to your understanding of climate change data.
WEMC are continuously developing the Teal tool, and are currently working on data for sea, land and global areas separately. We are planning to evolve the Teal tool further by developing new datasets on various climate models for projections. Our aim is to provide a dynamic range of forecasts for the Teal tool users, to facilitate progression in research and education.
To keep up to date with WEMCs events and news, please subscribe to the WEMC newsletter and follow us on Twitter, LinkedIn, and YouTube.


