2024 Rainy Season Forecast: Key Shifts and Predictions for Southeast Africa
In this blog, we will discuss the 2024 October-December (OND) rainy season forecast for Southeast Africa, including updates to forecasting models, new data sources, and the expected shifts in rainfall patterns compared to 2023. With a transition from El Niño to La Niña, this year’s forecast reflects significant changes in the timing of the rainy season across the region.
Model Updates and Data Enhancements
This year, our forecasting model has undergone a few key updates:
Switch from ECCC System 3 to System 4: One significant change is the transition from the previous System 3 to the more advanced System 4 within the ECCC dynamical seasonal forecasting system. This system in general improves the accuracy of the dynamical seasonal forecast for this predictor (Environment and Climate Change Canada, n.d.), thereby potentially increasing the skill of our hybrid Random Forest system.
New Datasets: For 2024, we are training our model using two different observational dataset MSWEP (as last year) and CHIRPS:
- CHIRPS (Climate Hazards Group InfraRed Precipitation with Stations) is designed for drought monitoring, particularly in regions with sparse data. It combines satellite data (Cold Cloud Duration estimates) with ground station measurements to produce high-resolution (0.05°) daily and monthly rainfall estimates. Its focus on agricultural monitoring makes it highly useful for regions like Africa where precipitation variability is critical (Funk et al. 2015).
- MSWEP (Multi-Source Weighted-Ensemble Precipitation), on the other hand, blends multiple sources including ground stations, satellite data, and reanalysis products. With global coverage and a slightly coarser resolution (0.1°), MSWEP offers high temporal detail with 3-hourly estimates, making it particularly effective for hydrological modeling and flood risk assessments (Beck et al. 2019).

Figure 1 illustrates the OND rainy season onset comparison between two rainfall datasets: CHIRPS and MSWEP. The first two panels show the spatial distribution of mean onset dates as calculated by each dataset, where CHIRPS (panel 1) and MSWEP (panel 2) highlight regional variations in the onset of the rainy season. Panel 3 shows the difference in mean onset days between the two datasets, with positive values indicating later onset in CHIRPS and negative values representing earlier onset compared to MSWEP. Panel 4 reveals the correlation between CHIRPS and MSWEP onset dates across the region, where high positive correlations signify agreement in spatial and temporal patterns over most of the domain. The analysis is based on data from the period 1993-2016.
The two datasets are both used at a 0.25×0.25-degree grid and at daily timesteps. Using two different reference datasets helps us to highlight potential local uncertainties related to their differences, which is particularly important for a noisy variable like precipitation.
The 2024 Forecast and Shifting Patterns
This year’s forecast reveals a dramatic reversal in patterns compared to the 2023 season. Last year’s predictions, likely heavily influenced by El Niño conditions (Roy and Troccoli 2024), forecasted a mix of early onset in north/northeast areas of the domain and late onsets across the southern part of the domain. However, 2024 sees the emergence of La Niña conditions in fall, which has led to a significant shift in the expected onset of the rainy season with opposite signs compared to last year’s forecast. Figure 2 shows the forecast from September of the OND rainy season from 2023 and 2024 together with the difference between the two years.
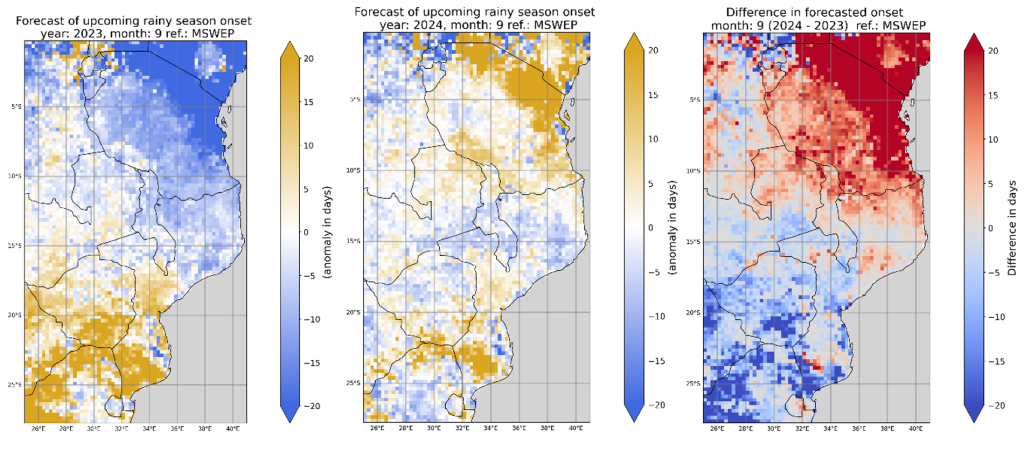
The reversal in rainfall onset timing is largely attributed to the evolving ENSO state. In 2023, El Niño drove much of the forecast with early onset in north east and later in southern areas, whereas in 2024, La Niña is expected to bring early rainfall in some southern areas, with more delayed patterns in the northern areas of the domain.
Forecast Consistency Across Lead Times
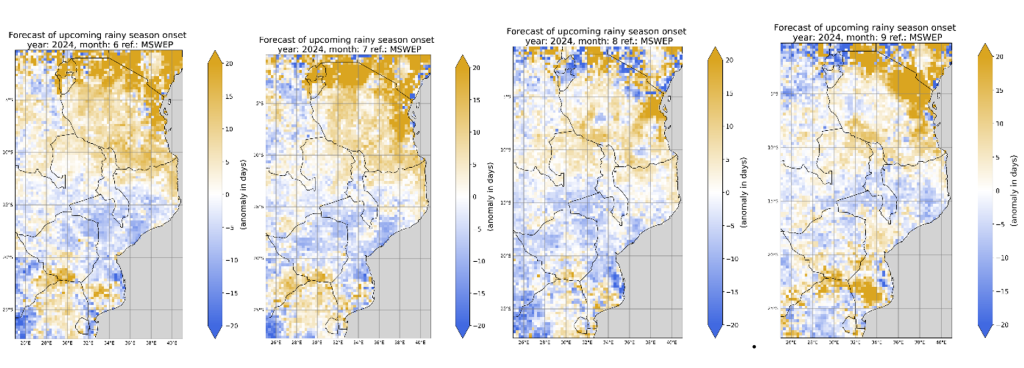
Figure 3 illustrates the forecasted anomaly of rainy season onset dates for the 2024 October-December season, across four different forecast start dates from June to September. The spatial patterns of the onset anomalies show a notable consistency across lead times, with key regions, particularly in the southern and central parts of the domain, consistently indicating early onset (blue regions) and northern regions predicting a delayed onset (yellow regions).
The agreement between forecasts suggests a robust signal emerging for the 2024 rainy season onset. Despite slight variations in anomaly magnitude between the different lead times, the overall pattern remains stable, indicating that the La Niña-driven earlier onset in southern regions and delayed onset in northern areas is a consistent feature of the forecast. This temporal consistency enhances confidence in the forecast. Moreover, it is quite remarkable that the general pattern of anomalies was already present in the June forecast, several months ahead of the OND rainy season.
How skillful is the forecast?
To answer the question of how skillful our forecast is we used The Continuous Ranked Probability Skill Score (CRPSS). CRPSS is based on the Continuous Ranked Probability Score (CRPS), which measures the difference between the predicted cumulative distribution function and the observed distribution (Hersbach, 2000). Essentially, the lower the CRPS, the closer the forecast is to the observed outcome. The CRPSS is a metric used to evaluate the skill of probabilistic forecasts by comparing the model’s performance against a reference forecast, in this case, the climatology (i.e., the long-term average over the period 1993-2016). CRPSS values range from -∞ to 1, where 1 indicates a perfect forecast, 0 implies the model performs similarly to the climatology, and negative values suggest the model performs worse than the climatology. The CRPSS values shown in the plot have been calculated using a hindcast period from 1993 to 2016. This approach enables us to assess the reliability of the forecast model over time by testing it against past data.
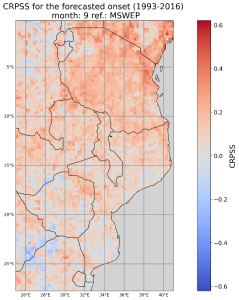
The results reveal mostly positive values (shaded in red), indicating that the forecast model outperforms the climatological reference across most regions for the October-December 2024 rainy season onset forecast from September. However, a few localized regions, particularly in the south Westen part of the domain, exhibit near-zero or slightly negative values, suggesting lower forecast skill in these areas.
Conclusion
As the 2024 rainy season in Southeast Africa approaches, this forecast offers valuable insights into the shifting rainfall patterns. The transition to La Niña is a key factor driving these changes, and we will continue to monitor and update the forecast as necessary. Stakeholders in the region can use this information to better prepare for the months ahead.
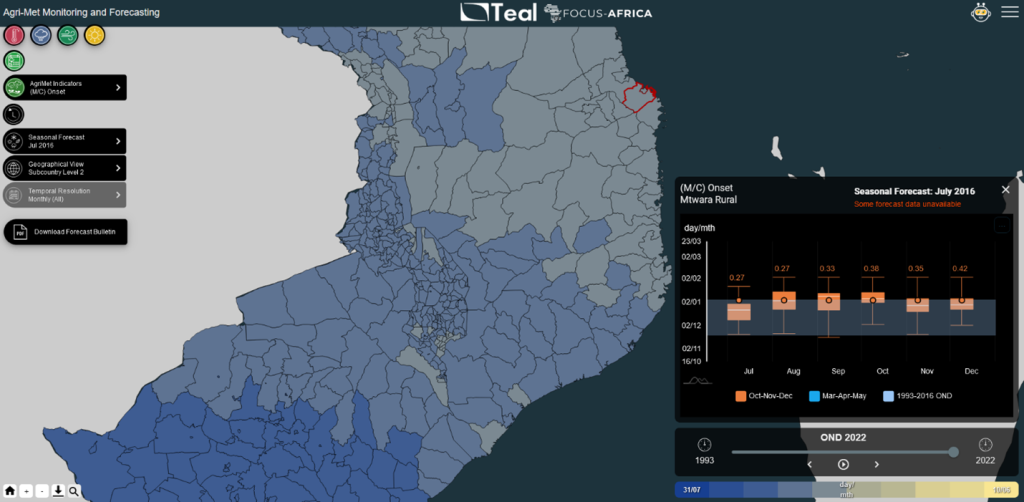
For a more detailed understanding of our forecasting methodology, please refer to our 2023 blog. Additionally, WEMC and Inside Climate Service srl provide an online visualization service, offering monthly forecast updates and comparisons with historical data through a bespoke version of the Teal tool, developed under the FOCUS-Africa project. While this latter version of Teal is currently only accessible by partners in the project, please get in contact if you are interested in a demo.
References
Beck, Hylke E., Eric F. Wood, Ming Pan, Colby K. Fisher, Diego G. Miralles, Albert I. J. M. van Dijk, Tim R. McVicar, and Robert F. Adler. 2019. “MSWEP V2 Global 3-Hourly 0.1° Precipitation: Methodology and Quantitative Assessment.” Bulletin of the American Meteorological Society. American Meteorological Society. https://doi.org/10.1175/bams-d-17-0138.1.
Environment and Climate Change Canada. n.d. “Canadian Seasonal to Inter-Annual Prediction System (CanSIPS) – Changelog.” ECCC Open Data. Accessed September 19, 2024. https://eccc-msc.github.io/open-data/msc-data/nwp_cansips/changelog_cansips_en/.
Funk, Chris, Pete Peterson, Martine Landsfeld, Diego Pedreros, James Verdin, Shraddhanand Shukla, Greg Husak, et al. 2015. “The Climate Hazards InfraRed Precipitation with Stations—A New Environmental Record for Monitoring Extremes.” Scientific Data 2 (1): 1–21. https://doi.org/10.1038/sdata.2015.66.
Hersbach, Hans. 2000. “Decomposition of the Continuous Ranked Probability Score for Ensemble Prediction Systems.” Weather and Forecasting. American Meteorological Society. https://doi.org/10.1175/1520-0434(2000)015<0559:dotcrp>2.0.co;2.
Roy, Indrani, and Alberto Troccoli. 2024. “Identifying Important Drivers of East African October to December Rainfall Season.” Science of The Total Environment. Elsevier BV. https://doi.org/10.1016/j.scitotenv.2023.169615.
Zampieri M, Toreti A, Meroni M, Bojovic D, Octenjak S, Marcos-Matamoros R, Materia S, Chang’a L, Merchades M, Chaves Montero M, Rembold F, Troccoli A, Roy I, Hoteit I (2023) Seasonal forecasts of the rainy season onset over Africa: Preliminary results from the FOCUS-Africa project. Climate Services 32, 100417, https://doi.org/10.1016/j.cliser.2023.100417


